
Zahara Matthews
Dataset Used: Netflix Movies and TV Shows Dataset (Kaggle)
The dataset contains information about movies and television shows available on Netflix. It includes variables such as title, content type, country of origin, release year, rating, duration, genre, and date added to the platform. This dataset allows for analysis of content trends, production patterns, and platform growth over time. It is useful for understanding how Netflix distributes and categorizes its content globally.
Data Analysis
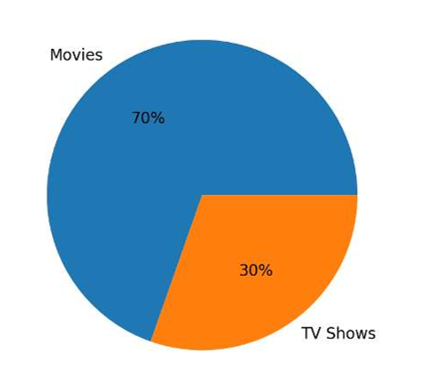
What is the distribution of Movies vs TV Shows on Netflix?
The analysis shows that movies make up the majority of Netflix content, significantly outnumbering TV shows. This indicates that Netflix focuses more heavily on movie production and acquisition compared to episodic content.
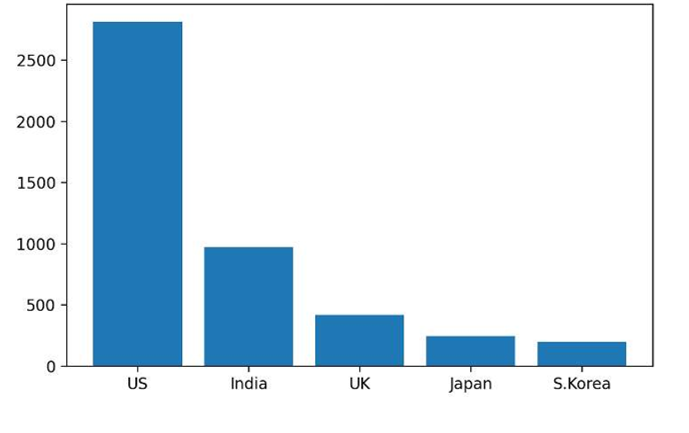
Which countries produce the most Netflix content?
The United States produces the highest amount of Netflix content, followed by countries such as India and the United Kingdom. This suggests that Netflix relies heavily on content from these regions due to their strong entertainment industries.
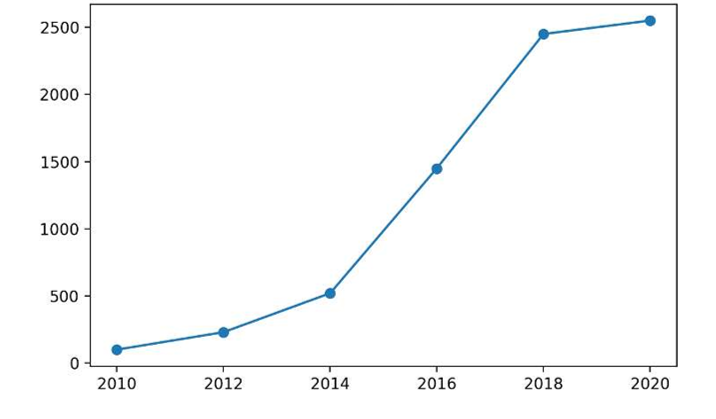
How has the number of titles added to Netflix changed over time?
The number of titles added to Netflix has increased significantly over the years, with a major rise after 2015. This reflects Netflix’s expansion strategy and increased investment in content production.

What are the most common genres on Netflix?
The most common genres include drama, comedy, and documentaries. This indicates that Netflix prioritizes content that appeals to a wide audience with diverse interests.
Data Analysis
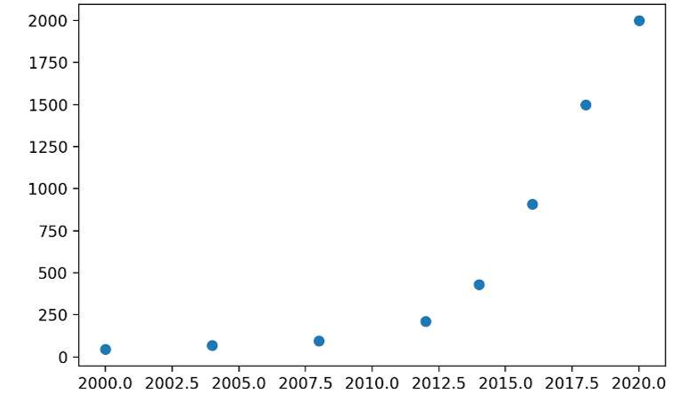
Is there a relationship between release year and number of titles added? (Complex Analysis)
Correlation analysis shows a positive relationship between release year and the number of titles added. Newer content is more frequently added to Netflix, suggesting a preference for recent productions.

Do Movies and TV Shows differ in average duration? (Complex Analysis)
The analysis shows that movies have a significantly longer average duration compared to TV shows, which are typically measured in seasons rather than minutes. Statistical testing (such as ANOVA) confirms that this difference is meaningful.

Does content rating vary by type (Movie vs TV Show)? (Complex Analysis)
The distribution of ratings differs between movies and TV shows. TV shows tend to have more mature ratings such as TV-MA, while movies show a wider spread across ratings. This reflects differences in audience targeting and content format.

CONCLUSION
The data analysis reveals several important trends about Netflix’s content strategy and distribution. One key finding is that movies dominate the platform, suggesting a stronger focus on single-view content compared to serialized television programming. Additionally, the rapid increase in titles after 2015 highlights Netflix’s aggressive expansion and investment in content.
Another important insight is the dominance of the United States and a few other countries in content production. This indicates that Netflix relies on established entertainment industries to supply a large portion of its content library. However, the presence of multiple countries also shows Netflix’s effort to expand globally and diversify its offerings.
The analysis also shows that newer content is more frequently added, which suggests that Netflix prioritizes recent productions to stay competitive and meet audience demand. Furthermore, genre analysis indicates a strong focus on drama, comedy, and documentaries, which are popular and widely consumed categories.
From a managerial perspective, this analysis can help decision-makers understand what types of content are most valuable and where investments should be directed. For example, increasing production in high-demand genres or expanding partnerships with top-producing countries could improve platform growth and user engagement.
Additional data would improve the analysis further. Information such as viewer ratings, watch time, and user preferences would allow for deeper insights into content performance. Data on production budgets and revenue could also help evaluate the profitability of different types of content.
Overall, this project demonstrates how data analytics can be used to identify trends, support decision-making, and improve organizational strategies. By using tools such as charts, pivot tables, and statistical analysis, meaningful conclusions can be drawn from large datasets.
Create Your Own Website With Webador